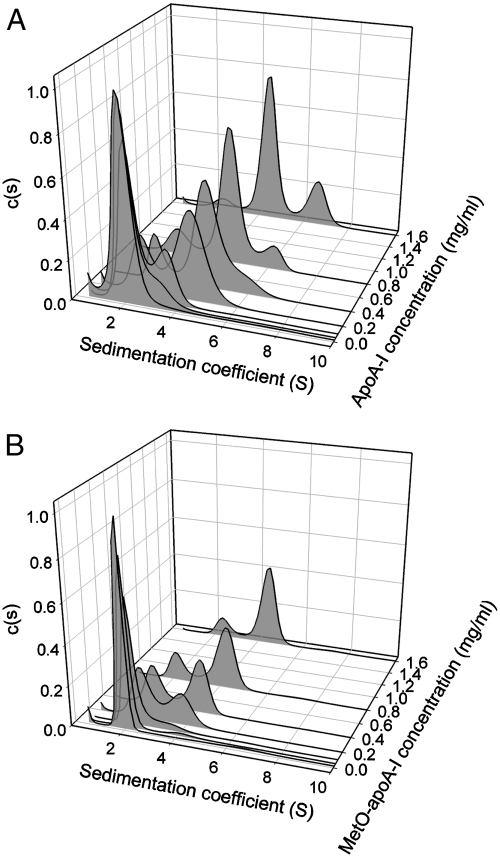
Fig. 2.
Sedimentation velocity analysis of (A) native apoA-I and (B) MetO-apoA-I. Sedimentation data acquired at protein concentrations from 0.02 mg/mL to 1.6 mg/mL were analyzed by using a continuous sedimentation coefficient distribution, c(S), and distributions were normalized with respect to integrated signal intensity.

