
Fig. 4.

Two structural solutions achieve the same catalytic end. (A) Ribbon representation of B. burgdorferi 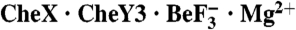 and E. coli
 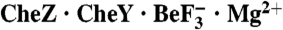 (pdb 1KMI) with superposition of CheY3 (green) and CheY (light green). CheX is cyan and CheZ is orange. CheX Glu96 (Left) and Asn99 (Right) are in cyan sticks. CheZ Asp143 (Left) and Gln147 (Right) are in orange sticks. The
  moiety is in purple sticks. (B) Close-up of region within the indicated square from Panel (A). Select active site groups from B. burgdorferi CheY3 (green) or E. coli CheY (light green) are shown. The residues are sticks and the divalent cations (Mg2+ for CheY3 and Mn2+ for CheY) are spheres.