Fig. 1.
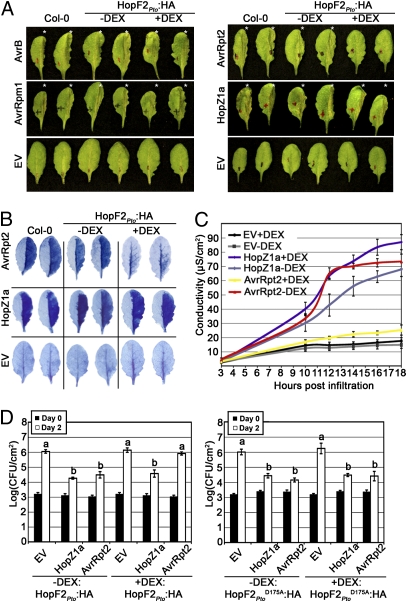
Transgenic expression of HopF2Pto suppresses AvrRpt2-mediated ETI. (A) Half-leaves of untreated HopF2Pto transgenic plants (−DEX) or HopF2Pto transgenic plants treated with DEX for 24 h (+DEX) were infiltrated with Pto DC3000 (5 × 10⁷ cfu/mL) expressing the indicated avirulence gene or empty vector (EV). Photographs of AvrB, AvrRpm1, or corresponding EV control were taken 6 h after inoculation, whereas HopZ1aPsyA2, AvrRpt2, or corresponding EV were taken ≈20 h after inoculation. Asterisks indicate leaves with visible HR collapse. (B) Trypan blue staining of untreated (−DEX) or 24 h DEX-treated (+DEX) HopF2Pto transgenic leaves 14 h postinoculation. (C) Electrolyte leakage of untreated (−DEX) or 24 h DEX-treated (+DEX) HopF2Pto transgenic leaf disks after infiltration with Pto DC3000 expressing the indicated constructs. (D) Growth analysis of Pto DC3000 expressing the indicated avirulence gene or the empty vector (EV) infiltrated into HopF2Pto or HopF2Pto D175A transgenic plants. Plants were treated with 30 μM DEX (+DEX) or water (−DEX) immediately after bacterial inoculation. Bacterial counts were performed 1 h postinoculation (day 0; filled bars) and 2 days postinoculation (day 2; open bars). Although Pto DC3000 empty vector did not grow significantly better in DEX-treated HopF2Pto:HA plants after 2 days of growth, a significant growth enhancement was observed after 3 days of growth (Fig. S7). Results are representative of three independent replicates. Error bars represent the SD from eight samples. “a” or “b” above the bar denotes statistically significant [Fisher’s protected least significant difference post hoc (FLSD) test, P < 0.05] differences between samples. Similar results were obtained with an independent transgenic HopF2Pto line, as well with a lower DEX concentration of 3 μM (Fig. S8).

