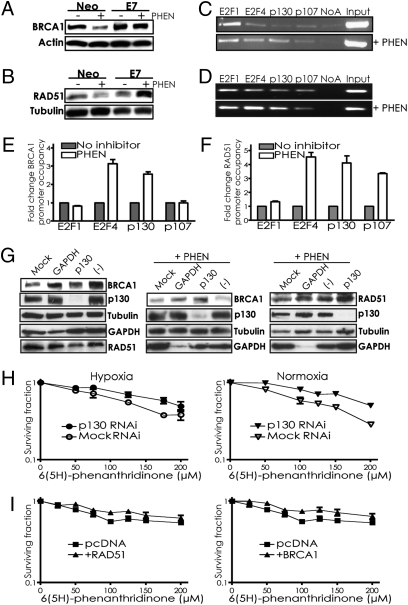
Fig. 4.
PARP inhibitor–mediated suppression of BRCA1 and RAD51 is reversed by E7 expression or p130 knockdown, occurs via E2F4 and p130 occupancy of the respective promoters, and contributes to the cytotoxicity of PARP inhibition. (A and B) RKO cells expressing either E7 or a vector control (Neo) were treated or not with 200 μM PHEN and assayed by immunoblot for (A) BRCA1 or (B) RAD51 expression. ChIP assays of (C) BRCA1 or (D) RAD51 promoter occupancy were performed using antibodies to the indicated factors with lysates from A549 cells treated or not with 200 μM PHEN. Representative agarose gels containing BRCA1 or RAD51 promoter region PCR amplification products are shown. (E) Quantification by real-time PCR of BRCA1 or (F) RAD51 promoter occupancy by the indicated factors is shown, based on three independent ChIP assays, with error bars based on SEs. Promoter occupancy is expressed as the fold change relative to that observed in untreated cells. (G) BRCA1 and RAD51 levels were determined by Western blot in A549 cells that were treated or not with PHEN after transfection with either siRNAs targeting p130, GAPDH, nontargeting negative control pool, or no siRNAs (Mock). Note that the order of the lanes in the third panel is different from in the first and second panels. (H) Effect of p130 knockdown by siRNAs on survival of A549 cells treated with PHEN. Cells transfected or not with siRNAs targeting p130, as indicated, were placed in hypoxia or normoxia and then treated with increasing doses of PHEN for 72 h under normoxic conditions, followed by growth to allow colony formation. Error bars represent SEs based on three replicates. (I) Effect of forced BRCA1 or RAD51 expression on survival of MCF7 cells treated with PHEN. Cells transfected with cDNA expression vectors for BRCA1 or RAD51, or an empty vector control, were treated with increasing doses of PHEN for 72 h under normoxic conditions, followed by growth to allow colony formation. Error bars as above.

