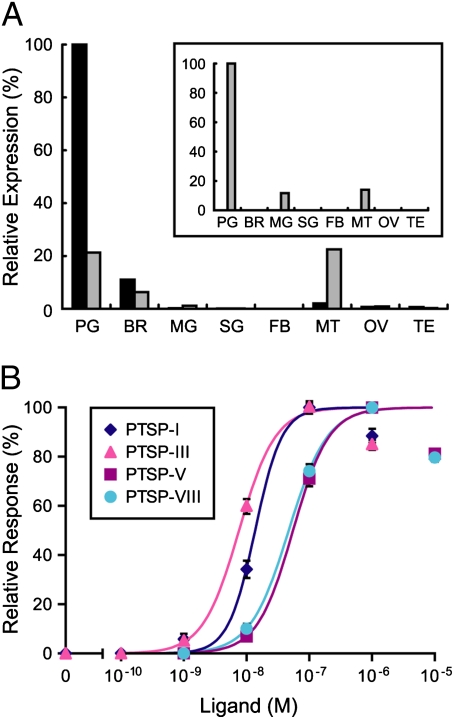
Fig. 4.
Identification of the PTSP receptor. (A) Tissue specificity of PTSPR/SPR expression analyzed by quantitative RT-PCR. For comparison, BMSR expression pattern is also presented (Inset). Transcript levels of the GPCR genes are presented as relative expression levels, which are normalized for each gene. Expression levels in the fourth instar head capsule slippage period are indicated in black, whereas those in the fifth instar day 2 are indicated in gray. PG, prothoracic gland; BR, brain; FB, fat body; MG, midgut; SG, silk gland; MT, Malpighian tubule; OV, ovary; and TE, testis. (B) Functional characterization of Bombyx PTSPR/SPR. Ca2+ imaging analysis was performed using HEK293 cells expressing PTSPR/SPR. Dose–response curves for PTSP-I, -III, -V, and -VIII are shown. Vertical bars represent SE. Each datum point was calculated from the responses of 150–165 cells in three independent experiments.

