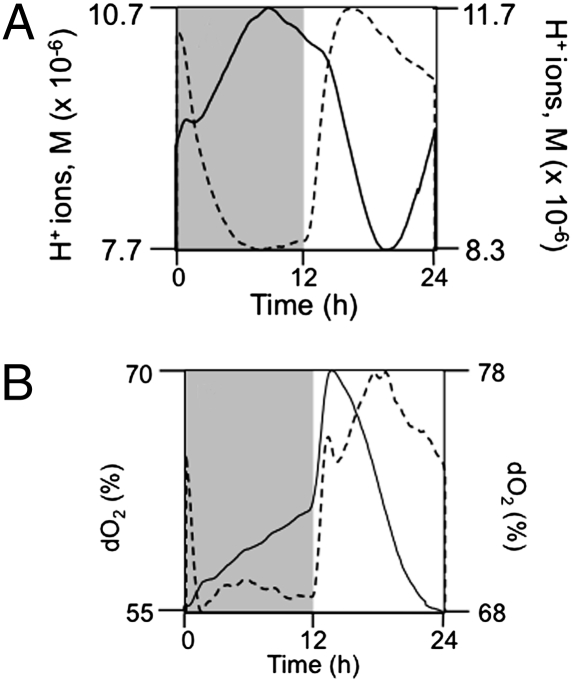
Fig. 2.
Phase relationships change with zeitgeber strength. (A) In lower temperature cycles (18 °C to 25 °C; dashed line), the peak of the H+ oscillation moves into the warm phase, later than the peak in warmer cycles (21 °C to 28 °C; solid line). (B) In the same cultures, the relationship between the peaks of the dO2 oscillations and the temperature cycle is largely preserved (solid and dashed lines as for A).

