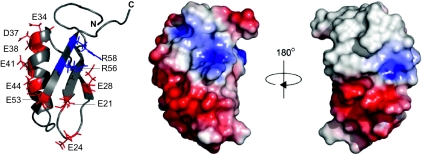
Fig. 2.
NMR-derived three-dimensional structure of Gp2. The left panel shows a ribbon representation of Gp2 indicating the side chains of the negatively charged amino acid residues and the conserved arginines at positions 56 (red) and 58 (blue). The middle and right panels show two views of the molecular surface of Gp2 (in the same orientation as the ribbon form) color-coded according to a basic electrostatic surface distribution, calculated using the vacuum electrostatics program in Pymol, version 0.99rc6.

