Fig. 3.
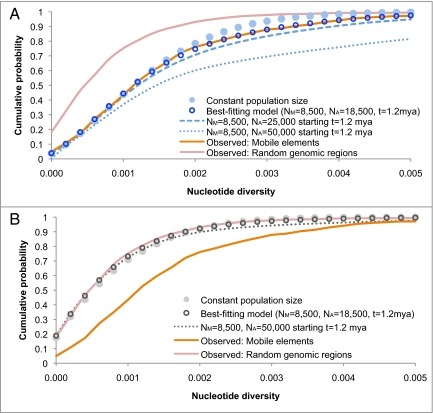
Cumulative probability distribution of SNP nucleotide diversity between HuRef and the reference sequence in 5,000-bp regions. (A) The distributions from simulated demographic models conditioned on the presence of a polymorphic insertion (demographic models shown in blue). (B) The unconditional distributions of the demographic models (show in gray). The orange line is the observed distribution in regions surrounding polymorphic insertions, while the red line is the observed distribution of 2,432 randomly chosen genomic regions. The best-fitting demographic model is the maximum likelihood estimate among all three-parameter demographic models considered, with a large ancient population size of NA = 18,500 starting t = 1.2 Mya (see Materials and Methods). Because genealogies that contain polymorphic mobile elements are ancient, the best-fitting model is clearly differentiated from the constant population size model in A. In contrast, the two models are nearly indistinguishable in B, demonstrating that the unconditional distribution of nucleotide diversity contains relatively little information about ancient population history, with only very large changes in ancient population size producing a noticeable effect (NA = 50,000). For the constant population-size model, the effective population size is n = 9,244, which is the effective population size for HuRef and the reference sequence based on genome-wide estimates of nucleotide diversity (23). The best-fitting model is significantly more likely than the constant population-size model (P = 2.5 × 10⁻¹⁶, likelihood-ratio test). The differences in the observed distributions for regions surrounding polymorphic insertions and regions chosen at random are highly significant (P < <10−30, χ2; Table S1). Nucleotide diversity is also stochastically greater in regions surrounding polymorphic insertions compared to regions chosen at random (P < <10−30, Mann-Whitney U).

