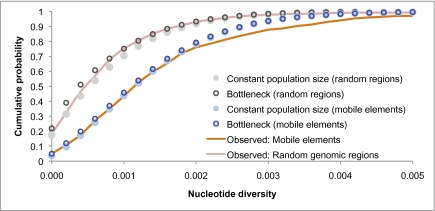
Fig. 5.
Effect of a population bottleneck on the distribution of nucleotide diversity. The orange line is the observed distribution in regions surrounding polymorphic insertions; the red line is the observed distribution of 2,432 randomly chosen genomic regions. While the unconditional distribution (random genomic regions) is sensitive to a recent population bottleneck, the effect on the conditional distribution (genomic regions that contain a mobile element insertion polymorphism) is very minor. The effective population size in the constant population-size model is n = 9,244 (Fig. 3). The bottleneck model is identical to the constant population-size model except for a single bottleneck event 3,500 generations ago of size F = 0.085, where F is the inbreeding coefficient (timing and severity of the bottleneck are from parameter estimates of the Out-of-Africa bottleneck in ref. 14).

