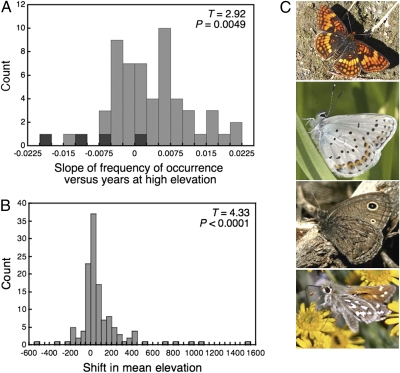
Fig. 3.
Montane shifts in frequency of occurrence and elevational range, with images of some of the species showing altered patterns of occurrence at the highest elevation. (A) The histogram shows the temporal trends for individual species at the highest site, CP. Values summarized are the slopes of regressions of occurrence versus years: Positive values indicate a species that has been more frequently observed over time at CP. Dark shading corresponds to slopes associated with four species that are considered alpine specialists. T and P values reported in each graph are the results of t tests asking whether the mean of the overall distribution differs from zero. (B) The histogram shows the distribution of elevational shifts by individual species along the west slope of the Sierra Nevada between early (1977–1986) and late (1988–2007) years, calculated from records at four sites, RC, LC, DP, and CP. The mean shift in elevation is 93.35 m (SE ± 21.56). (C) Chlosyne hoffmanni (Top) and Lycaeides idas (second from the Top) have been observed more frequently at CP, whereas Cercyonis oetus (third from the Top) and Hesperia nevada (Bottom) have been observed less frequently at CP in recent years (the latter two species are specialists of the alpine habitat at CP).

