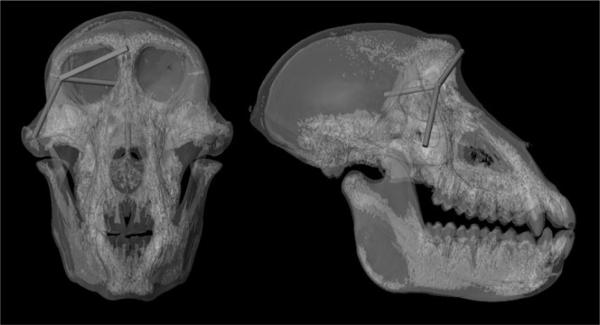
Figure 1.
Illustration of the four distances that showed either a G×S interaction or X-linkage in this sample of baboon skulls from an anterior view (left-hand side) and a right lateral view (right-hand side). Red lines represent distances that had a significant G×S interaction, green lines represent distances with significant X-linkage.

