Figure 1.

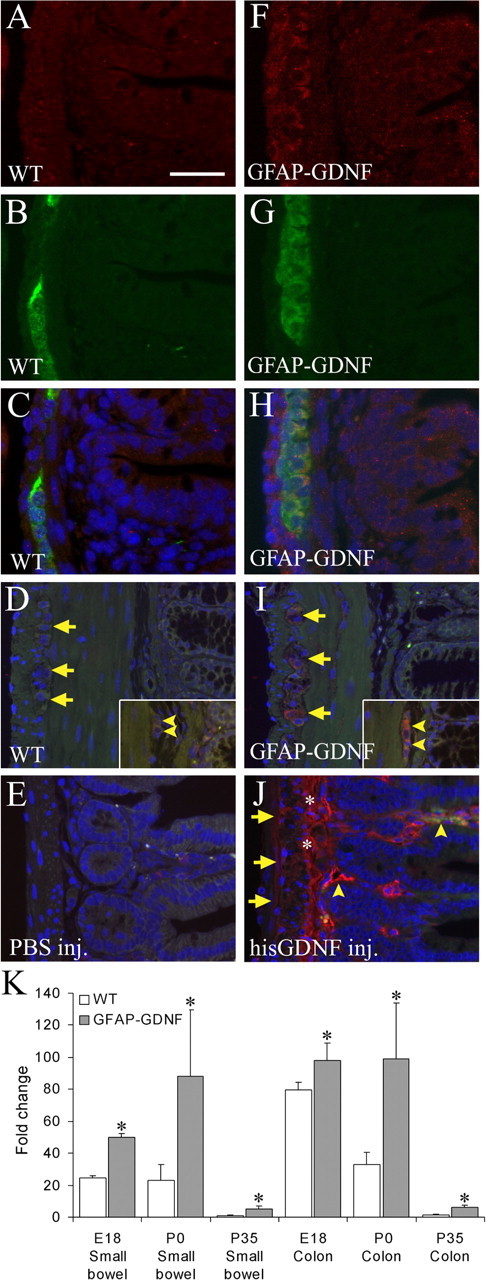
GDNF abundance is elevated near the ENS in GFAP–Gdnf and GDNF-injected mice. Immunohistochemistry for GDNF was performed on WT (A–D) and GFAP–Gdnf mouse small bowel (F–I) at E18 (A–C, F–H) and on adult colon (D, I). A, C, D, F, H, I, GDNF immunohistochemistry. B, C, G, H, PGP9.5 immunohistochemistry. C, H, Merged E18 images. C–E, H–J, Images have DAPI counterstaining to show nuclei. D, E, I, J, Autofluorescence in the green channel was used to highlight the anatomy in adult mice. E, J, Immunohistochemistry for the poly-His tag in the small bowel of mice injected with PBS (E) or His-tagged GDNF (J). D, I, Arrows indicate myenteric ganglia. Arrowheads indicate submucosal ganglia. J, Arrows show the myenteric region. * indicates the submucosal region. Arrowheads identify blood vessels. Scale bar: (in A) A–C, F–H, 25 μm; D, E, I, J, 50 μm. K, Gdnf mRNA levels are elevated in GFAP–Gdnf mice compared with WT littermates in both the small bowel and colon at E18, P0, and P35. Relative gut Gdnf mRNA levels were determined by quantitative real-time PCR after reverse transcription. The level of Gdnf mRNA in WT P35 small bowel was set to 1. *p < 0.05 versus WT for each time point.
