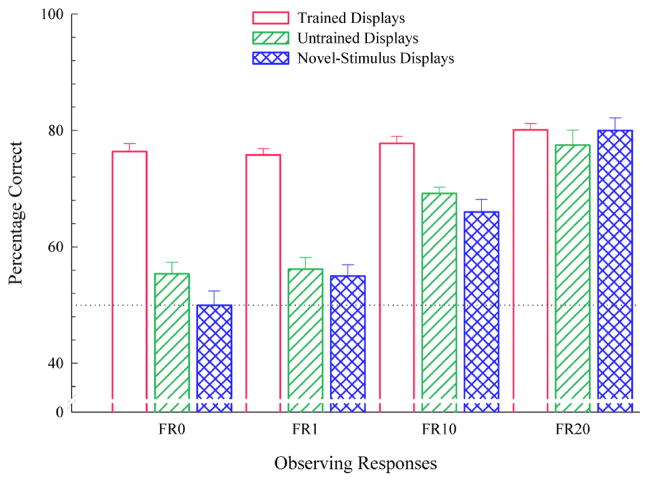
Figure 11.
Mean percentage correct for trained, untrained, and novel-stimulus displays from Wright (1997). Error bars represent SEMs. Data are further divided by the number of responses required to the sample for each group. Untrained displays refer to tests of the six displays not used in training. Novel-stimulus displays refer to tests with trial-unique novel cartoon items not seen in training. The dotted line represents chance performance. Note. From Figure 2, “Concept learning and learning strategies,” by A. A. Wright, 1997, Psychological Science, 8, p. 121. Copyright 1997 by Blackwell Publishing. Adapted with permission.

