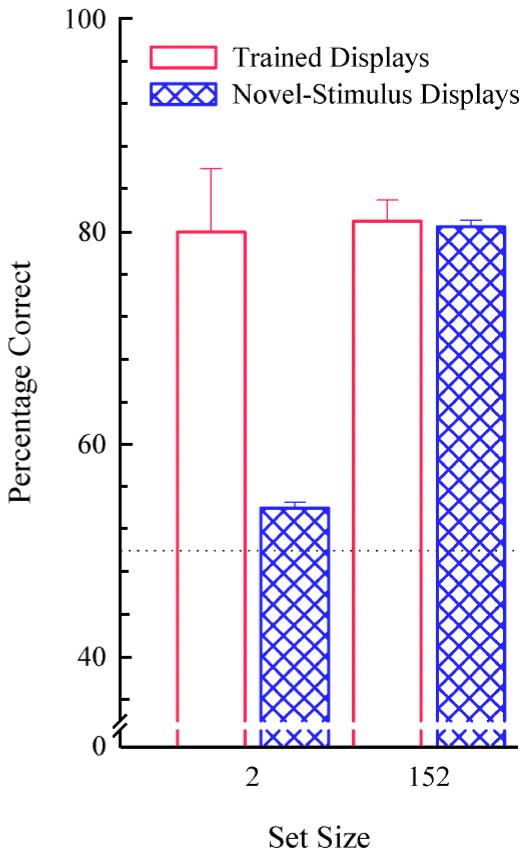
Figure 8.
Mean percentage correct for trained displays (baseline) and novel-stimulus displays (transfer) at each set size for separate groups of pigeons in the MTS procedure. Error bars represent SEMs. Note. From Figure 7, “Concept learning by pigeons: Matching-to-sample with trial-unique video picture stimuli,” by A. A. Wright et al., 1988, Animal Learning & Behavior, 16, p. 443. Copyright 1988 by the Psychonomic Society. Adapted with permission.

