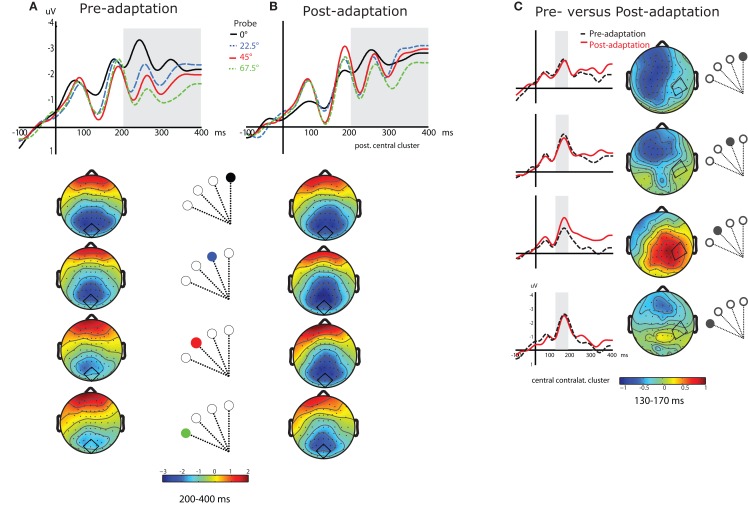
Figure 4.
(A) Grand averaged ERPs to each of the four probes in the pre-adaptation cued condition, from an example cluster (central posterior, depicted in each map) (probe located at 0°, black; 22. 5°, blue dashed; 45°, red; 67.5°, green dashed). Topological maps below show the distribution of the effect for each probe in the second time interval (200–400 ms), corresponding to the gray shaded area in the ERP traces. (B) ERPs from an example cluster (central posterior) in the post-adaptation cued condition, and the corresponding maps for each probe. (C) Grand averaged ERPs to each probe location in the cued condition for pre-adaptation (black dashed lines) versus post-adaptation (red lines), from an example cluster (central contralateral, depicted in the maps). The gray shaded area in the ERPs corresponds to the first time interval (130–170 ms) which is also illustrated in the corresponding difference maps (pre-adaptation–post-adaptation).

