
Fig. 3. Ca2+/calmodulin activation of wild-type and charge reversal mutant smooth muscle myosin light chain kinases.
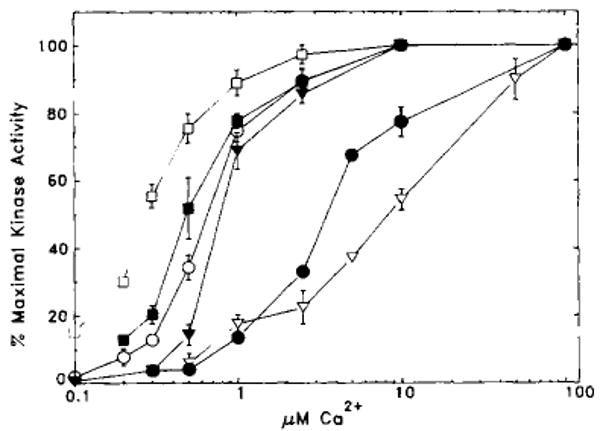
Kinase assays were performed as described under “Materials and Methods.” The percentage of maximal kinase activity is plotted versus free Ca2+ concentrations. The data are presented as mean ± S.E. from three or four independent assays, each performed in duplicate. If no error bar is visible, the S.E. is less than the size of the symbol. A summary of the data is presented in Table I. ○, wild type; ●, K979E; ▽, RRK974–976EED; ▼, KK969–970EE; □, KK961–962EE; ■, KK961–962EE/KK969–970EE.