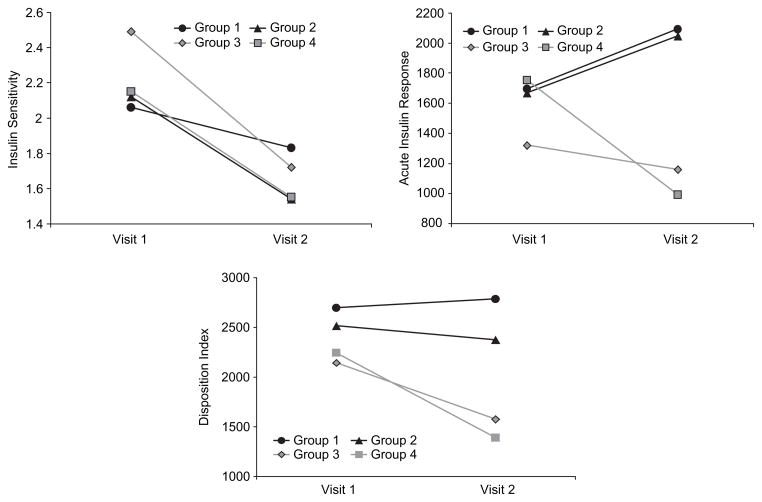
Figure 1.
Key variables at baseline (visit 1) and 1-year later (visit 2) in sub-groups of children classified according to changes in maturation stage over the 1-year follow-up period. Note that these data are least square means from the repeated measures analysis of variance after adjusting for baseline body fat mass and age:
Group 1 (black line, circles): Children who remained at either Tanner stage 1 or 2 (i.e. early maturation, non-progressors; n = 49)
Group 2 (black line, triangles): Children who progressed from Tanner stage 1 or 2 to 3 (i.e. early maturation, progressors; n = 40)
Group 3 (grey line, rhombus): Children who progressed from Tanner stage 3 to 4 or 5 (i.e. mid- to late-maturation progressors; n = 22)
Group 4 (grey line, square): Children who remained at either Tanner 4 or 5 (i.e. late maturation non-progressors; n = 21)

