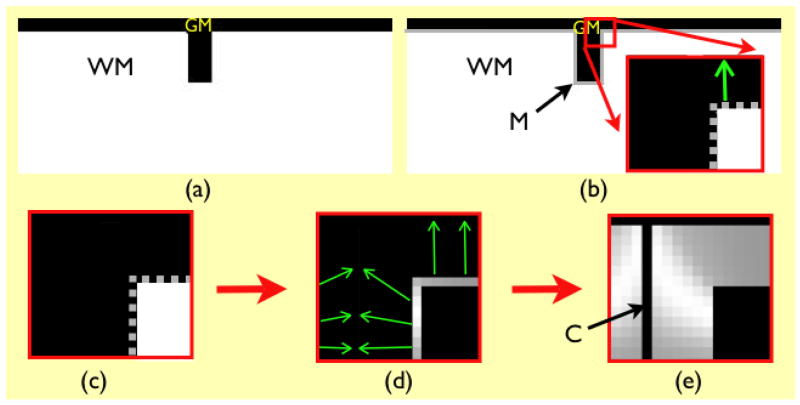
Fig. 1.
Overview of proposed methodology. The original gray matter and white matter images are shown in (a). In (b), M is the initial cortical model, a thin (one voxel thick) sheet, with the inner edge at the gray/white interface, and the outer edge within gray matter. The region enclosed in red is zoomed in to show the initial model (also in (c)), in which M is represented as a gray dotted line. Panel (d) shows how the initial model is deformed to find the estimated gray/csf interface, and establish point-to-point correspondences (green arrows). Gray levels at the gray/white interface denote the distance between corresponding points, which is the measure of thickness. The thickness values are propagated to the GM volume to generate the volumetric thickness map shown in (e), where C denotes the estimated location of gray/csf interface.

