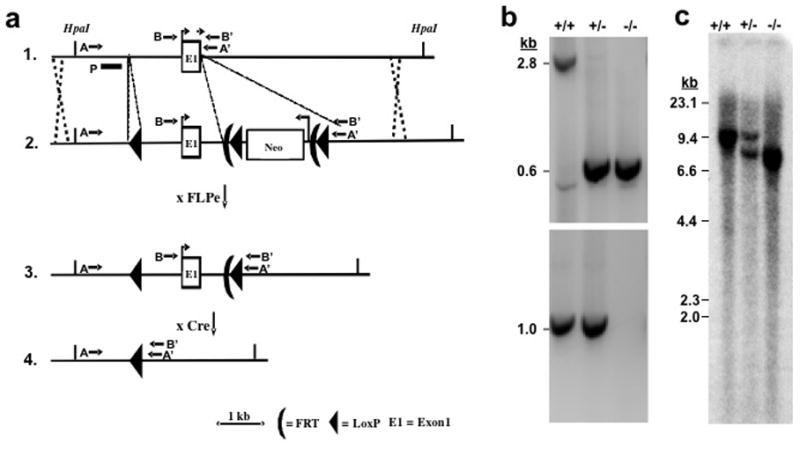
Figure 1. Targeting strategy for knocking out the mouse PGT gene.

(a) Strategy used for PGT gene targeting. Top line: endogenous locus; 2nd line: targeting vector; 3rd line: targeted locus after excision of Neo gene cassette with FLPe; Bottom line: targeted locus after excision of Exon 1 at LoxP sites with Cre recombinase. A targeting vector containing a 13 kb mouse genomic DNA segment was constructed with 3 LoxP insertions, two of them flanking a Neo gene insertion, which also includes two FLPe recombinase sites. The locations of PCR primers (AA′ or BB′) are shown by arrows. P signifies the hybridization probe for Southern blots.
(b) Genotyping of wild type (+/+), heterozygote (+/−), and global KO mice (−/−). PCR products from the intact PGT Exon 1 gene and from the gene lacking Exon 1 generated 2.8 kb and 0.6 kb fragment, respectively (Primers AA′). Because of competition in the PCR reaction, both products could not be visualized in DNA from heterozygotes. Therefore, a second PCR reaction (BB′: 1.0 kb) was used to demonstrate the wild type allele (bottom gel). Global KO mice show only 0.6 kb.
(c) A restriction enzyme HpaI as used for Southern blot hybridization. A 9.8 kb band in the wild type allele was replaced by an 7.9 kb band in the targeted allele.
