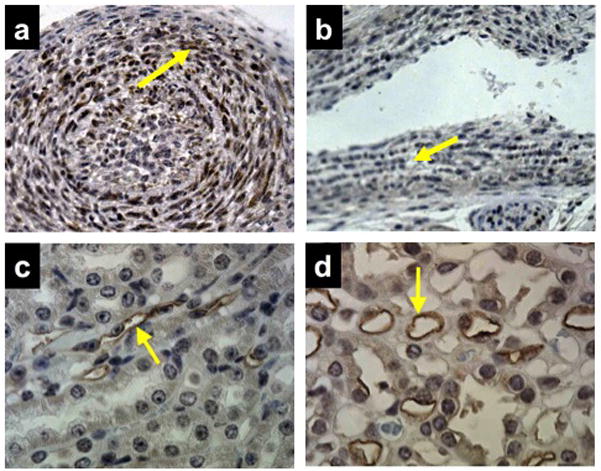
Figure 6. Immunolabeling for PGT shows strong expression in the normal DA compared to the kidney.

(a) DA of wild type mouse (n = 3) on post-natal day 1 showing strong labeling for PGT in smooth muscle cells of the myointimal thickening (brown reaction product, arrow).
(b) DA of PGT Neo/Neo mouse (n = 3) on post-natal day 1 with negative PGT labeling (arrow).
(c and d) Labeling of mouse renal cortical collecting duct (c, arrow) and mouse renal papillary vasa recta endothelium (d, arrow) as positive controls (n = 10).
