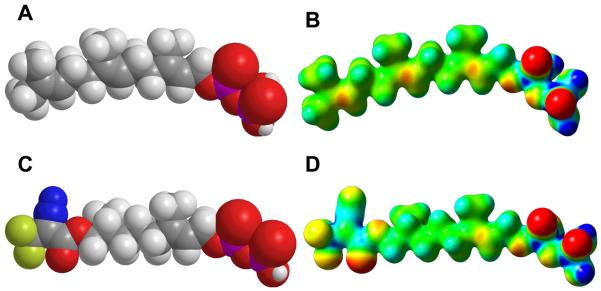
Figure 15.
CPK models and molecular electrostatic potential (MEP) maps calculated for FPP and dihydroester 4. Above: CPK model (A) and MEP (B) for FPP. Below: CPK model (C) and MEP (D) for 4. For MEP maps, potentials were plotted on a surface of constant density (density = 0.02). Electronegative areas are shown in red and electropositive areas are shown in blue.

