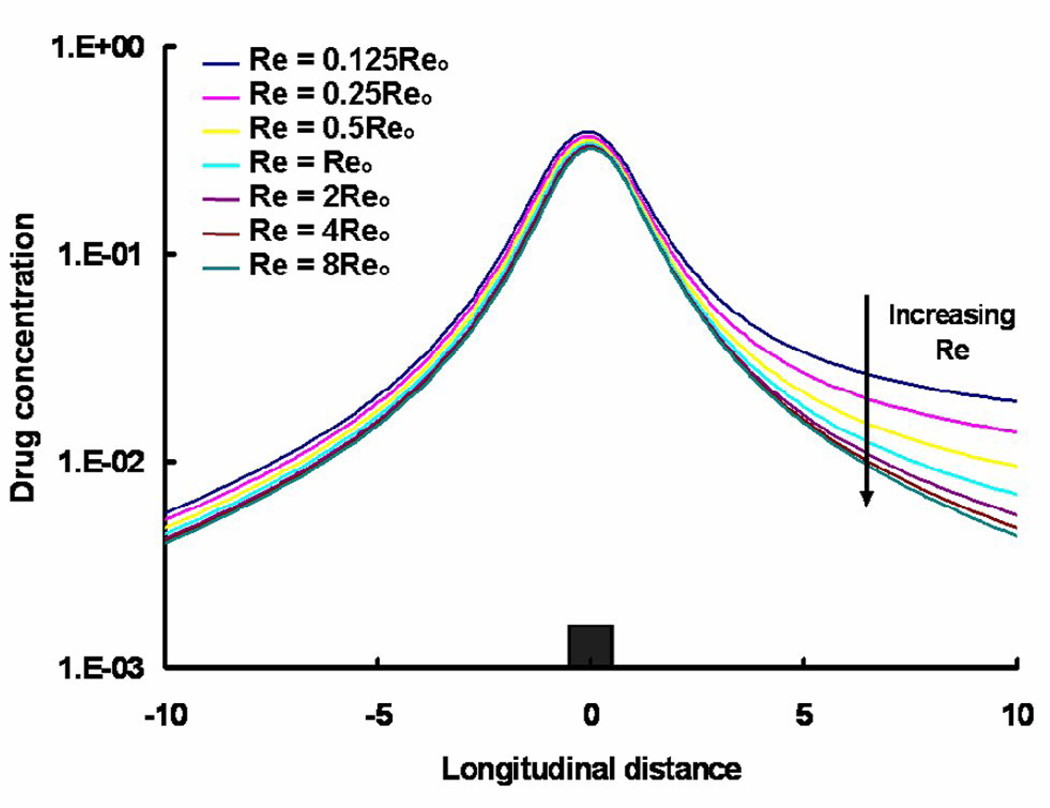
Fig. 6.
Variation in the free drug concentrations (log scale) with Reynolds number at one strut depth below the mural surface is shown. Reo denotes the Reynolds number with respect to the steady state case evaluated in Sections 2.5 and 3.1.1. , where Δx is the cell size and C is the normalized drug concentration. The integral is performed over a length (20 struts) along the longitudinal direction of the vessel.

