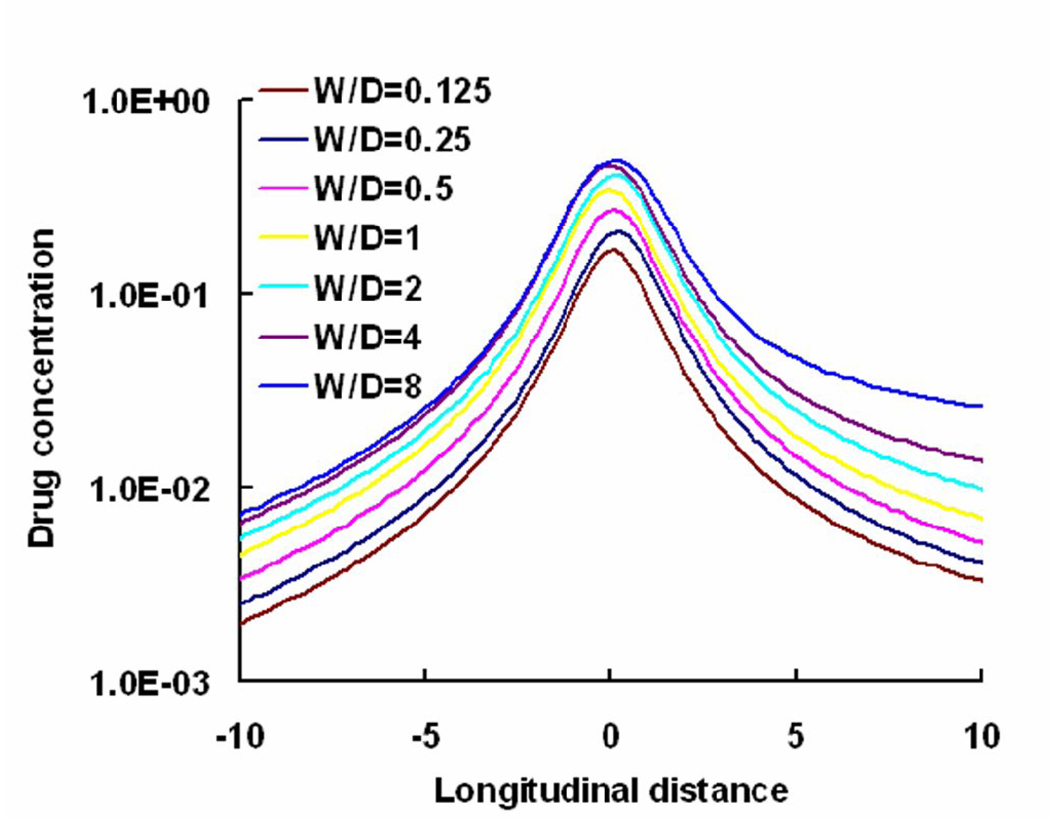
Fig. 8.
Free drug concentration (log scale) at one strut below the blood-tissue interface increased with aspect ratio (W/D). Note that the perimeter of the strut was held constant for all the depicted cases. Drug concentration was plotted in log scale and, the longitudinal distance from the lumen was normalized with respect to the strut width for the case W/D=1. Note that the W/D=1 case corresponds to Re=Reo case in Fig 4(b).

