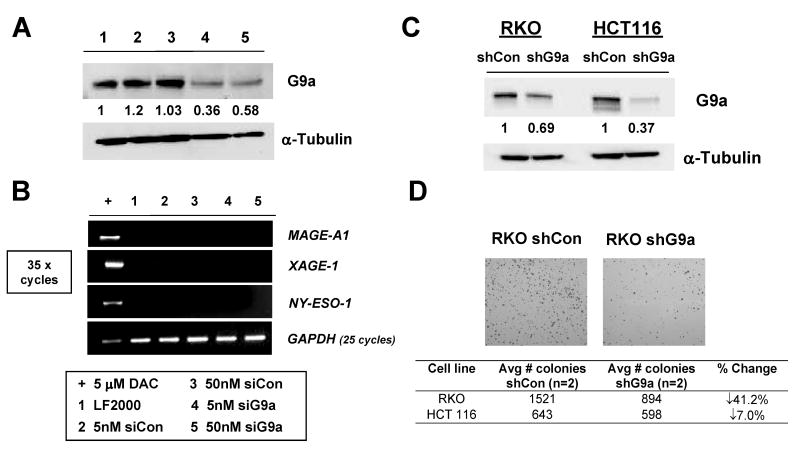
FIGURE 1.
Transient and stable G9a knockdown in human cancer cells. A. Transient siRNA knockdown of G9a in RKO cells. Control and G9a-specific siRNAs were administered at either 5 or 50nM, cells were harvested at day 5, and G9a expression was measured by Western blot. α-tubulin expression was measured as control for protein input, and band densitometry was performed as described in the Materials and Methods. The sample key is shown below panel B. B. End-point RT-PCR analysis of MAGE-A1, NY-ESO-1, and XAGE-1 for the experiment shown in panel A. GAPDH expression was analyzed to control for cDNA input, and amplification of cDNA from RKO cells treated with 5 μM DAC (decitabine) served as a positive control for CG antigen gene expression. CG antigen gene amplification was performed for 35 cycles, while GAPDH was performed for 25 cycles. The sample key is shown below panel B. LF2000= lipofectamine-only transfection control. C. Western blot analysis of G9a protein expression in control shRNA (shCon) and G9a shRNA (shG9a) stable RKO and HCT116 cell lines. α-tubulin expression was measured as control for protein input, and band densitometry was performed as described in the Materials and Methods. D. shG9a stable-expressing cells have reduced clonogenicity. Upper: Representative images of crystal violet-stained colonies of control and G9a knockdown stable RKO cells. Lower: Quantification of colony number in control and G9a knockdown stable RKO and HCT116 cell lines.

