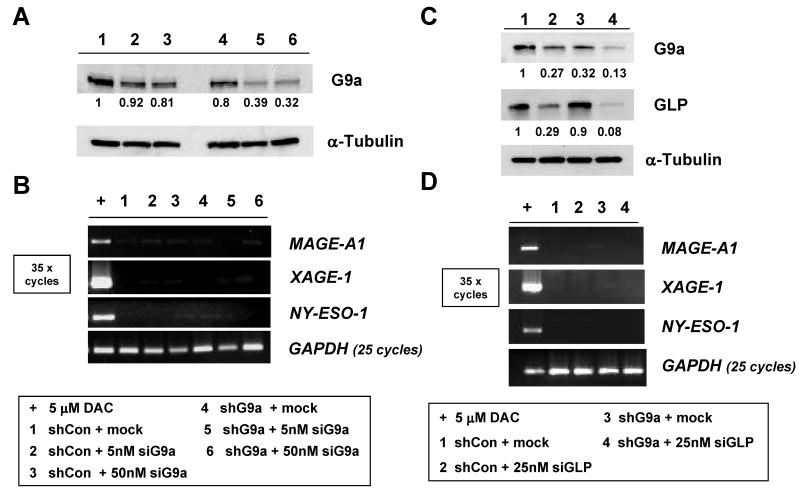
FIGURE 4.
CG-X antigen genes are repressed in RKO cells following dual shRNA/siRNA G9a knockdown, or dual G9a/GLP knockdown. A. RKO cells stably expressing control shRNA or G9a shRNA were mock transfected or transfected with a G9a-specific siRNA. Cells were harvested five days post transfection and G9a protein levels were measured by Western blot. α-tubulin expression was measured as control for protein input, and band densitometry was performed as described in the Materials and Methods. The sample key is shown below panel B. B. RT-PCR analysis of CG antigen gene expression. PCR conditions and controls are the same as described in Figure 1B, and the sample key is shown below panel B. C. RKO cells stably expressing control shRNA or G9a shRNA were mock transfected or transfected with a GLP-specific siRNA. Five days post-transfection, G9a and GLP protein levels were measured by Western blot. α-tubulin expression was measured as control for protein input, and band densitometry was performed as described in the Materials and Methods. The sample key is shown below panel D. D. RT-PCR analysis of CG antigen gene expression. PCR conditions and controls are the same as described in Figure 1B, and the sample key is shown below the panel.

