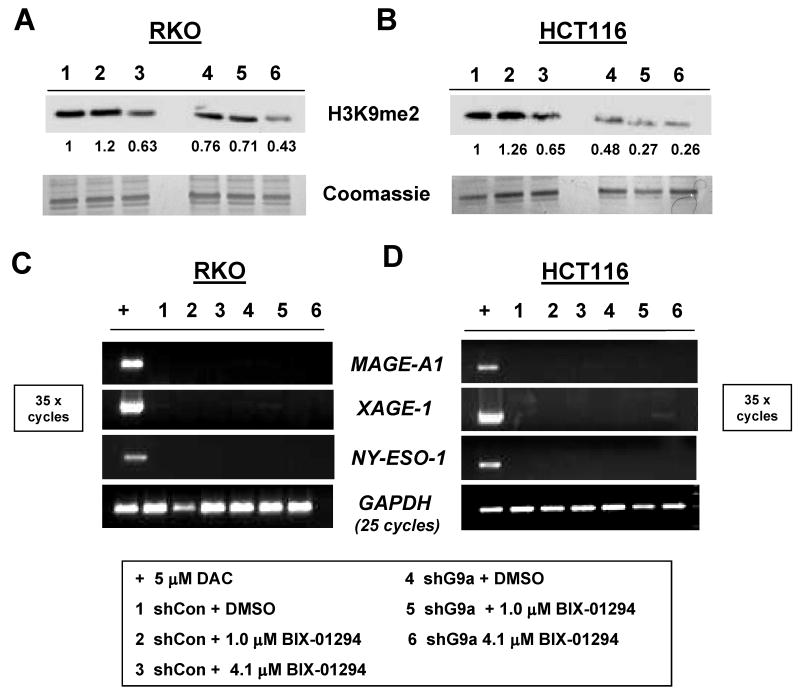
FIGURE 5.
Combined genetic and pharmacological targeting of G9a in human cancer cells. (A-B) RKO (A) and HCT116 (B) cells were treated with DMSO (vehicle) or BIX-01294, cells were harvested 48 hours later, and H3K9me2 levels were determined by Western blot analyses. Coomassie staining confirmed equal protein input, and band densitometry was performed as described in the Materials and Methods. The sample key is shown at the bottom of the figure. (C-D) RT-PCR analysis of CG antigen gene expression in the experiment described in panels A-B. PCR conditions and controls are the same as described in Figure 1B, and the sample key is shown below the figure.

