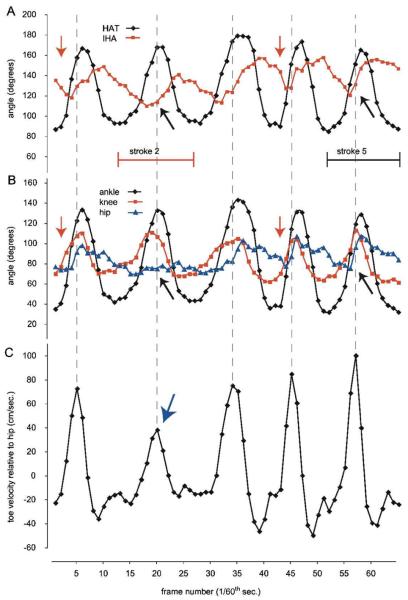
Figure 2. Angular Excursion and Toe Velocity for Stick Figures Representing the Hindlimb.
Note: A, The changes over time in the IHA and HAT angles using the 3-segment model for 5 complete stroke cycles. B, The same 5 stroke cycles are shown as changes over time in the hip, knee, and ankle angles using the 4-segment model. The red arrows indicate that HAT (in A) or knee (in B) extension precedes extension of the other angles for each step cycle. The black arrows indicate the reduced or delayed extension of the IHA (in A) or hip (in B) during the power stroke phase of stroke 2, and for comparison the same points in stroke 5. C, The velocity of the toe relative to the hip, with the rostrocaudal direction (power stroke) being shown as positive velocity. The blue arrow indicates the reduced peak toe velocity that results from the reduced hip extension in stroke 2 when compared with stroke 5. IHA indicates iliac crest–hip–ankle; HAT, hip–ankle–toe.

