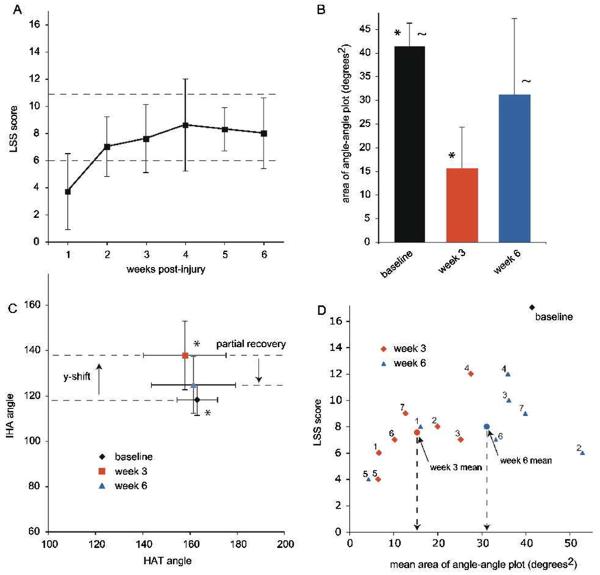
Figure 6. Postinjury Assessments: Louisville Swim Scale and Angle-Angle Plots.
Note: A, The mean Louisville Swim Scale (LSS) scores for all 7 animals, over time postinjury. The dashed lines indicate the transition points in the scale when most animals acquire frequent to consistent hindlimb movement with some retained reliance on forelimbs for forward motion (6-7) and when animals show consistent hindlimb alternation with only occasional reliance on forelimbs for forward motion (11-12). B, The mean areas of the angle–angle (HAT–IHA) plots are shown for preinjury baseline and weeks 3 and 6 postinjury. There is a significant difference in area at week 3 compared with baseline (*; P < .001) and at week 6 compared with week 3 (~; P < .05). C, The mean x and y centroids for the angle–angle plots are shown for preinjury baseline and postinjury weeks 3 and 6. There is a significant shift in the y position (IHA) at week 3 (*; P < .05) compared with baseline and a recovery toward baseline by week 6. D, Weeks 3 and 6 postinjury LSS scores are plotted against the area of the angle–angle plots for individual animals. The mean angle–angle plot area increases significantly from week 3 to week 6 despite the fact that the mean LSS scores do not change over that time period. IHA indicates iliac crest–hip–ankle; HAT, hip–ankle–toe.

