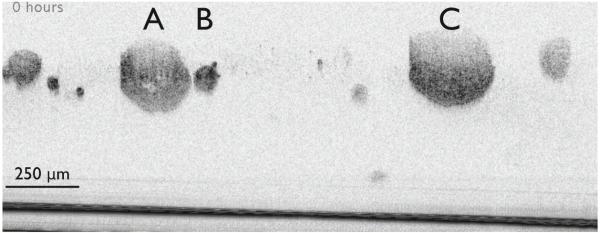
Fig. 5.
(Media 5) Time-lapse OCT movie of acinar growth and development. Two neighboring B-scans were averaged.The movie runs for 92 hours, beginning on day 13 of growth. The camera was run at a rate of 3076 Hz for an integration time of 325 μs per A-line. Volumes were collected continuously, with a full 2 mm × 1 mm × 1.6 mm volume recorded every hour. Three acini are labeled in the figure, here called “A”, “B”, and “C”.

