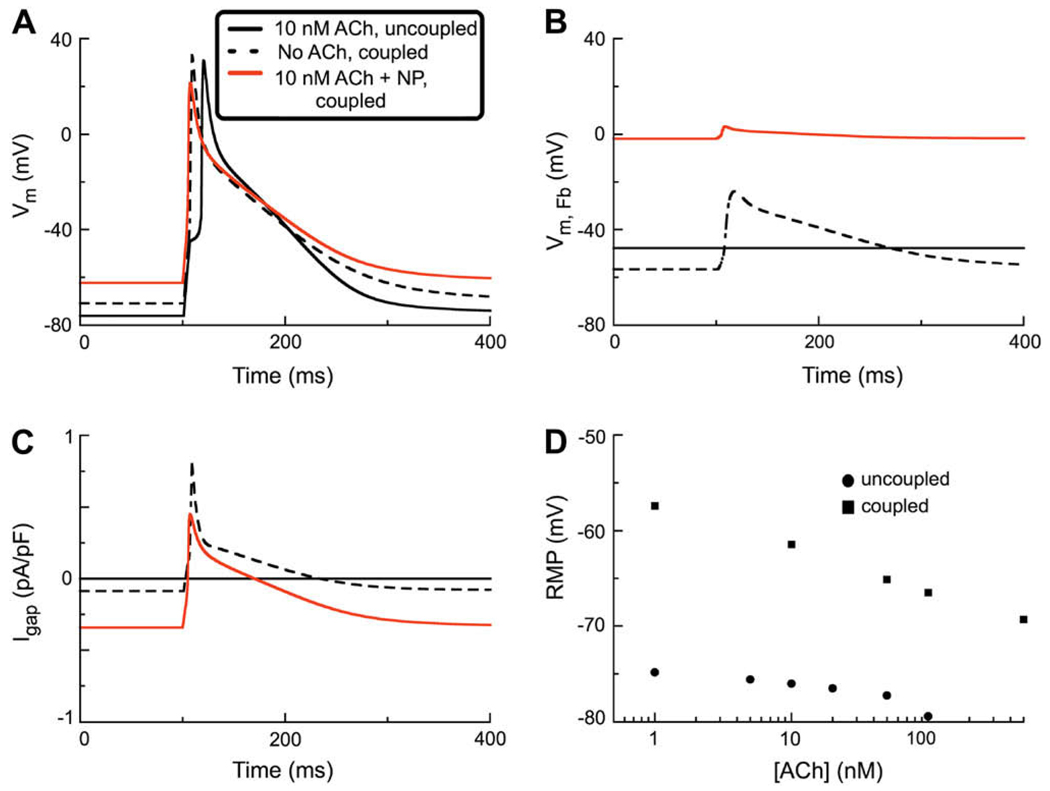
Fig. 5.
Simulations of the human atrial action potential in a coupled myocyte/fibroblast system with both IK(ACh) and INP activated. The stimulus current (280 pA, 6 ms) was applied at 1 Hz and a fixed coupling resistance (0.5 nS) was assumed. A The action potential waveform denoted by the solid black trace illustrates the effect of activation of the IK-ACh in this situation which assumed no intercellular coupling. Note the increased latency, or delay, in the firing of the AP. In this panel the superimposed red trace shows the changes produced by electrotonic coupling to one fibroblast in which INP is activated. Note: (i) depolarization of the RMP, and (ii) prolongation of the APD. The dashed line shows the AP waveform assuming no activation of IK-ACh, in the presence of INP in one coupled fibroblast. B shows the corresponding changes in the fibroblast membrane potential VFb. Solid black line: control RMP in fibroblast (no coupling). Note that activation of INP causes a large depolarization (red trace). The dashed line is the VFB with IK(ACh) and INP activated. C shows the gap junction current under the three conditions chosen: black trace – resting, control fibroblast; red trace – INP activated; dashed trace – both IK(ACh) and INP activated. D Two concentration–response relationships for RMP vs. [ACh]. The black circles (●) show the effect of activation of IK-ACh on RMP in an uncoupled atrial myocyte (see also Fig. 3). The black squares (■) are analogous data from simulations assuming (i) myocyte–fibroblast coupling (0.5 nS); and (ii) activation of INP in the fibroblast.

