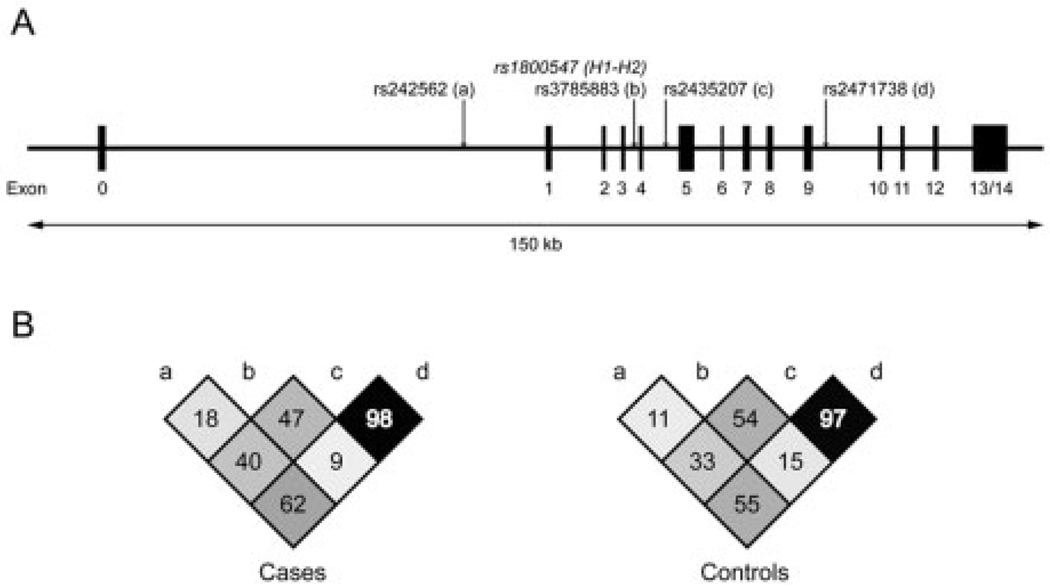
Fig. 1.
Schematic of the MAPT gene and patterns of linkage disequilibrium (LD). (A) The positions of the single nucleotide polymorphism (SNP; rs1800547) used to define the H1 and H2 haplotype clades and of the four H1-SNPs (a–d) used to construct subhaplotypes are indicated by arrows. (B) Comparison of LD among H1-SNPs (a–d) in cases and control subjects. The numbers in each plot represent pairwise D′ values × 100.

