
Figure 4. Obese HCC-bearing mice exhibit activated STAT3 and elevated expression of inflammatory cytokines.
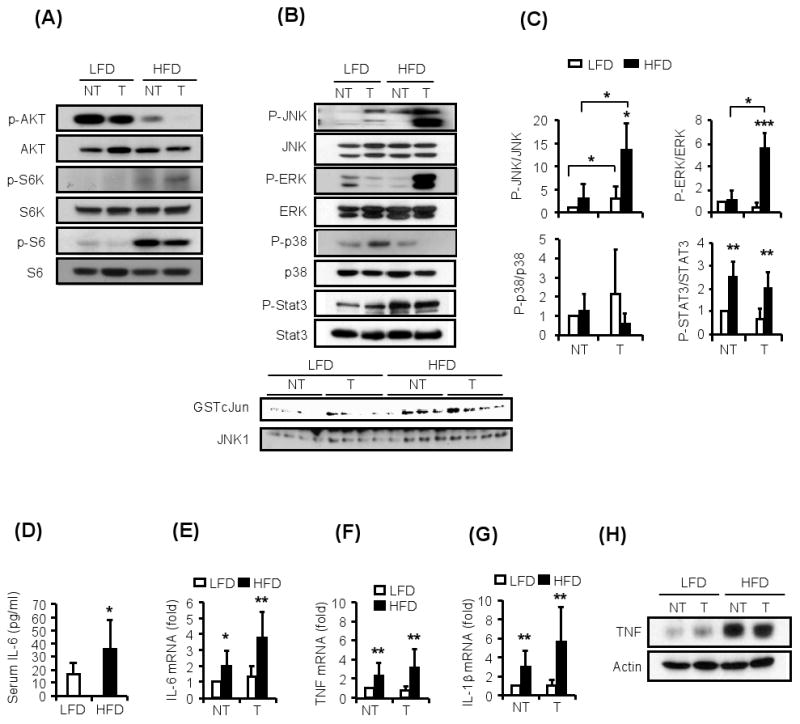
The HCC-bearing mice from Figure 2 were subjected to additional biochemical and gene expression analyses.
(A). Activation state of metabolically-regulated protein kinases. Non-tumor (NT) liver and HCC (T) were lysed, gel separated and the activation (phosphorylation) states of AKT and S6 kinase (S6K) were examined by immunoblotting.
(B). Non-tumor (NT) liver and HCC (T) were analyzed for phosphorylation of JNK, ERK, p38, and STAT3 by immunoblotting as above. The bottom panel shows JNK kinase assays in non-tumor liver and HCCs of 4 different mice per dietary group.
(C). The results of several immunoblots similar to the one shown in B, each representing a different mouse, were quantitated using Image J software and mean values were determined (n=3-4).
(D). Serum IL-6 in HCC-bearing mice was determined by ELISA (n=10-12).
(E-G). Relative amounts of IL-6 (E), TNF (F) and IL-1β (G) mRNAs in non-tumor (NT) liver and HCC (T) were determined by qRT-PCR and normalized to cyclophilin mRNA (n=6-8).
(H). TNF amounts in non-tumor liver (NT) and HCC (T) were examined by immunoblotting of tissue lysates.
All values represent means ± s.d. *P<0.05, **P<0.01, ***P<0.001 denote significant differences between the groups. See also Supplemental Figure S3.