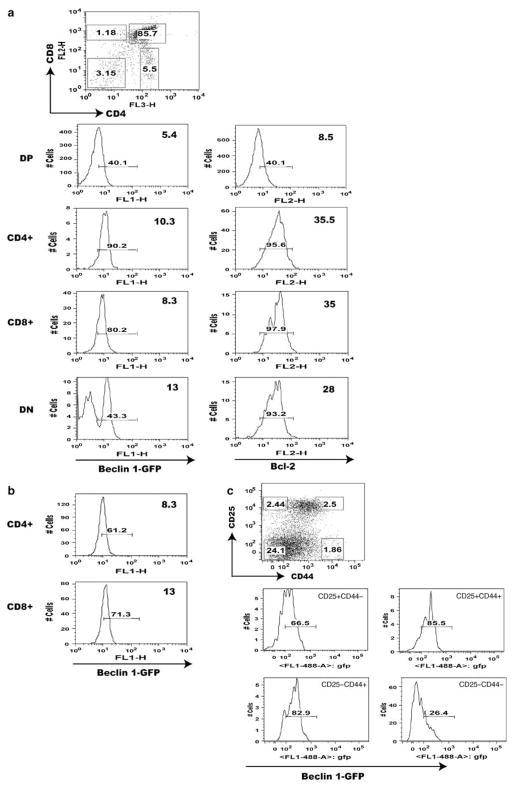
Figure 2.
Flow cytometry analysis of Beclin 1-GFP expression in major populations of transgenic T cells. (a) Beclin 1-GFP and Bcl-2 expression analysis in the thymus of Beclin 1-GFP transgenic mice. The percentage of Beclin 1-GFP positive cells within each thymocyte subset defined by corresponding gates in the top dot plot is indicated with small numbers within each histogram. The numbers in the upper right corner of each histogram represent mean fluorescence intensities (MFI) for each subset within indicated histogram gates. The histograms in (b) indicate Beclin 1-GFP expression in mature spleen CD4 + and CD8 + cells. (c) The histograms represent Beclin 1-GFP + fluorescence for each group of of pregated CD3−CD4−CD8− triple-negative Beclin 1-GFP + TN transgenic thymocytes defined by the gates indicated in the CD44 versus CD25 dot plot. Data are representative of at least four independent experiments

