Figure 4.
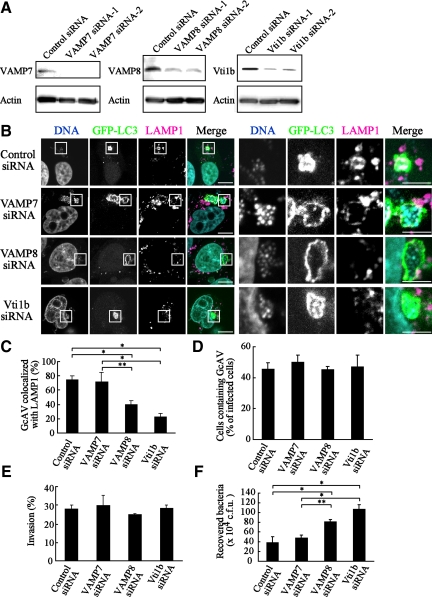
Knockdown of VAMP8 and Vti1b disturbed the antimicrobial effects of GcAVs. (A) HeLa cells were transfected with siRNA for the control, VAMP7, VAMP8, and Vti1b. At 48 h after transfection, the cells were lysed and then examined by Western blotting using anti-Vti1b, -VAMP7, -VAMP8, and actin antibodies. (B) HeLa cells expressing GFP-LC3 were treated with siRNA in the same manner as described in A. After 48 h, cells were infected with GAS for 60 min at an MOI of 100. After an additional 120 min of incubation with antibiotics for bacterial killing, the cells were fixed and incubated with anti-LAMP1 antibodies and observed with a confocal microscope. Cellular and bacterial DNAs were stained with DAPI. The boxed regions in the left panels are shown enlarged in the right panels. Bars, 10 μm (left) and 5 μm (right). (C) Colocalization frequencies of GcAVs with LAMP1 signals were manually determined and are presented as the percentage of total number of GcAVs. Data shown represent results of >60 cells, and each ratio (percentage) represents the mean value ± SD from three independent experiments. *p < 0.01; **p < 0.05 by one-way ANOVA and Scheffé's posttest. (D) Numbers of cells containing GcAVs were counted and are presented as the percentage of the total number of GAS infected cells. HeLa cells stably expressing GFP-LC3 were transfected with siRNA and infected with GAS in the same manner as described in B. Data shown represent results of >30 cells and each ratio (percentage) represents the mean value ± SD from three independent experiments. (E) Efficiency of GAS invasion was measured as described in Materials and Methods. Data are shown as the mean ± SD from three independent experiments. (F) Viability of invaded GAS in HeLa cells was evaluated as described in Materials and Methods. Data are shown as the mean ± SD from three independent experiments. *p < 0.01; **p < 0.05 by one-way ANOVA and Scheffé's posttest.

