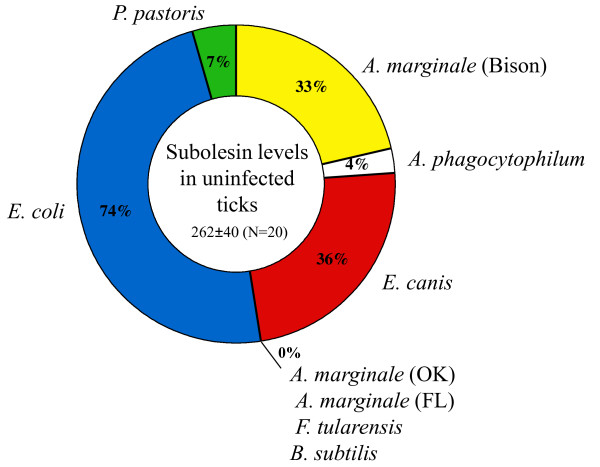
Figure 5.
Tick-to-tick variations in subolesin expression in response to pathogen infection. The graph depicts the percent of infected male D. variabilis ticks that showed normalized subolesin mRNA levels higher than the average expression level in uninfected ticks. In all experiments, 27-29 infected ticks were analyzed. For experimental details see figure 4 legend.

