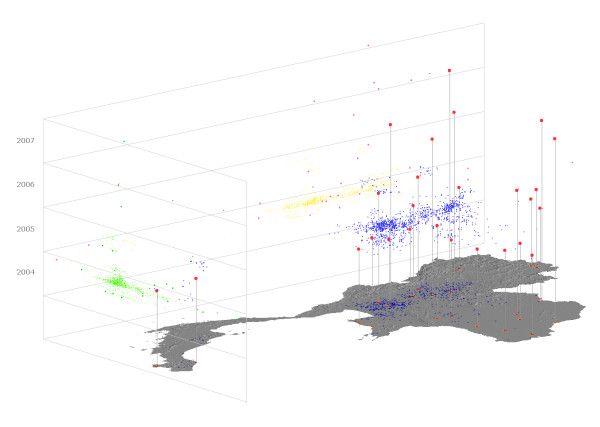
Figure 3.
Perspective view of HPAI cases in Thailand (28 days, 100 km). Vertical axis represents the time. Recorded cases are plotted in blue, and projected in green on the (longitude, time) plan, and in yellow on the (latitude, time) plan. 'Emergent' cases are plotted in red, and projected in dark green on the (longitude, time) plan and in purple in the (latitude, time) plan.

