
Figure 4.
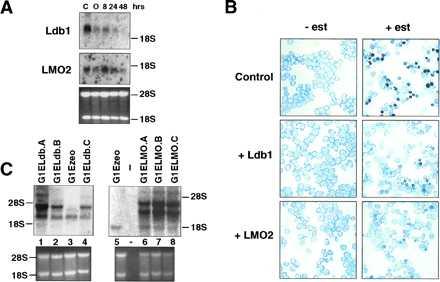
Ldb1 and LMO2 block erythroid differentiation of G1ER cells. (A) Northern blot analysis of total RNA from untreated (C) parental G1E cells (25), and those from G1ER cells after estrogen induction for the indicated times. In G1ER cells, the lower molecular weight transcript (2.3 kb) was more abundant, but the higher 3.5-kb RNA species was visible on longer exposure. As a control for RNA loading, the ethidium bromide stained gel displaying 28S and 18S RNA is given. Glyceraldehyde-3-phosphate dehydrogenase levels decrease during differentiation and therefore do not provide a control. (B) Benzidine staining of infected cells prior to (−est) and 48 hr (+est) after induction with estrogen. Darkly stained cells are benzidine positive. The figures shown are representative of six independent experiments. (C) Northern blot analysis of Ldb1 and LMO2 expression in infected G1ER cells. Total RNA was isolated from G1ER cells infected with vector alone (G1Ezeo) and those infected with Ldb1 or LMO2 cDNA-containing retroviruses. The major endogenous Ldb1 (lane 3) and LMO2 (lane 5) transcripts are clearly visible. Ethidium bromide stained agarose gels, shown in the lower panel, provide a monitor for RNA loading.