
Figure 5.
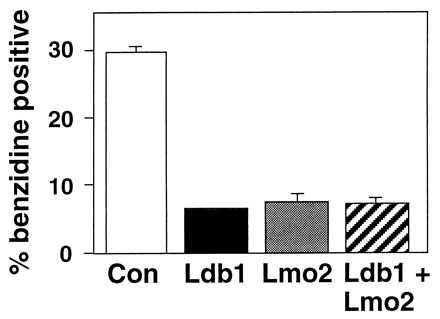
Degree of benzidine staining in infected G1ER cells. The mean values for benzidine positive cells expressed as the percentage of total cells in pools of infected G1ER cells are based on six independent experiments except for Ldb1 and LMO2 coinfected cells, for which three experiments were performed. For each sample, greater than 600 cells were scored for benzidine positivity. Bars = SEM.