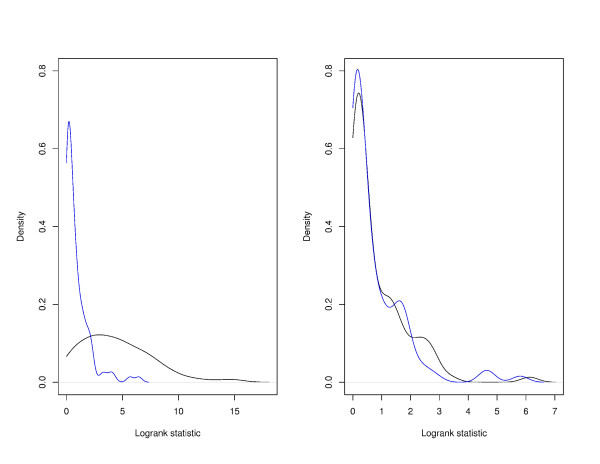
Figure 1.
Densities of OPI and PPI. Left panel: the Dentatorubropallidoluysian atrophy pathway, which has predictive power; Right panel: the Thyroid cancer pathway, which does not have predictive power. Black line: density of OPI; Blue line: density of PPI. Data from [17].

