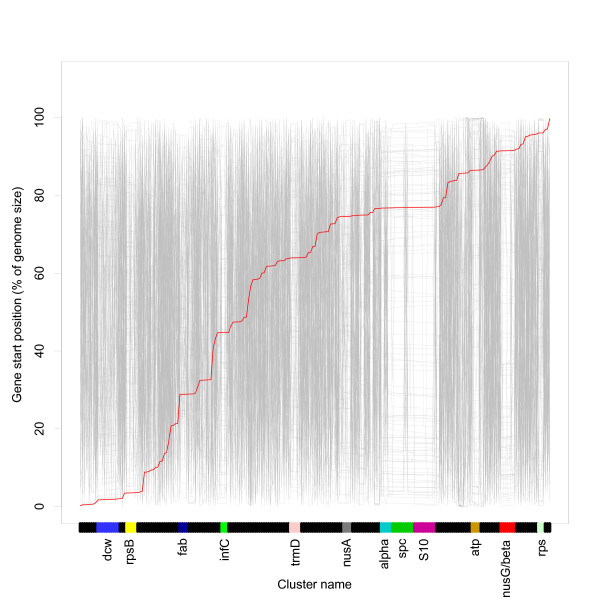
Figure 5.
Relative order of persistent genes in all genomes. The red line indicates the gene order of the reference organism, E. coli O157:H7. For the other genomes the order of the persistent genes has been sorted according to the reference organism, and the relative genomic position of the genes plotted along the y-axis. Relatively flat horizontal lines in the plot indicate regions with conserved gene clustering compared to the reference organism (i.e. we are moving short genomic distances between genes when they are sorted according to the E. coli gene order). We see several such regions, marked with the same colours as in Figure 4. However, outside these regions the intra-genomic gene distances are highly variable.

