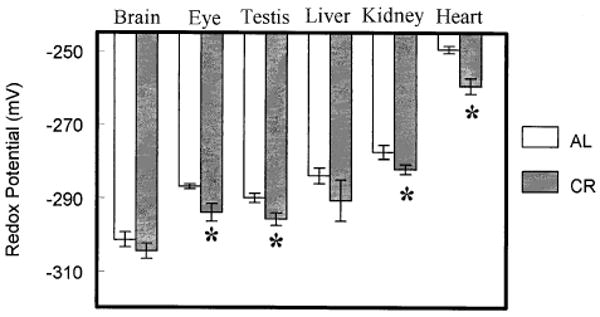
Fig. 3.

Glutathione redox potentials in mitochondria isolated from liver, kidney, heart, brain, eye, and testis of ad libitum-fed (AL) mice and calorically restricted (CR) mice at 22 months of age. Redox values were calculated using the Nernst equation and experimentally determined mitochondrial GSH and GSSG concentrations. All values represent the mean ± standard deviation of n = 4 groups, with four animals pooled in each group. * p < .05 based on paired t-test.
