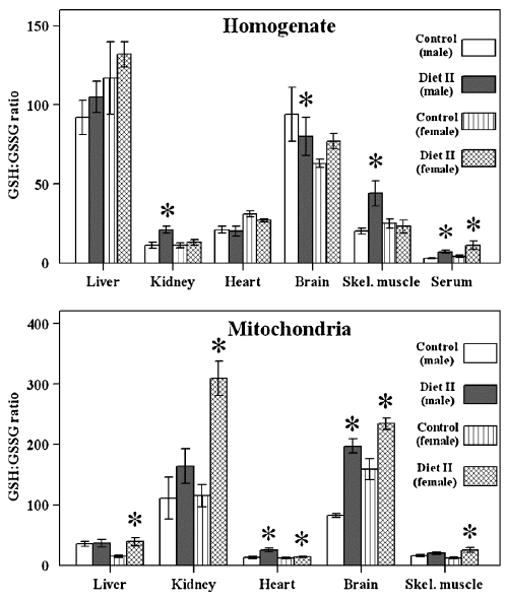
Fig. 4.

GSH:GSSG ratio in tissue homogenates and mitochondria from SAM mice fed with Diet II. GSH:GSSG ratio in homogenates (top panel) and mitochondria (bottom panel) of liver, kidney, heart, brain, skeletal muscle, and blood serum of control male, control female, experimental male, and experimental female SAM mice fed Diet II (n = 4 for each group). *A significant difference (P < 0.05) based on paired t test.
