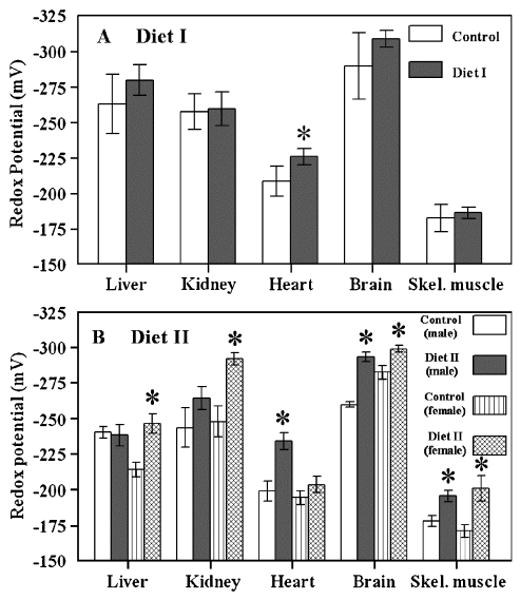
Fig. 5.

Glutathione redox potentials in mitochondria isolated from liver, kidney, heart, brain, and skeletal muscle of Sam mice fed Diet I (A) or Diet II (B). Redox values were calculated using the Nernst equation and the experimentally determined concentrations of mitochondrial GSH and GSSG, as described in Ref. [23]. All values represent the mean ± standard deviation of n = 4. *A significant difference (P < 0.05) based on paired t test.
