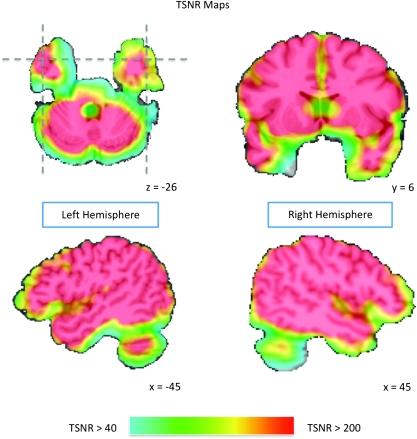
Figure 1.
Temporal signal-to-noise ratio (TSNR) maps showing EPI image quality over the anterior temporal lobes. The color gradient indicates the TSNR of the smoothed EPI time course data overlaid on the AFNI Talairach N27 atlas brain. TSNR was calculated by dividing the mean signal intensity at a voxel by the standard deviation of its signal time course. The color map is thresholded at a TSNR of 40, with all areas in red indicating a TSNR of at least 200. Simulations indicate that a TSNR of 40 (indicated in the map by light blue) is the minimum to reliably detect effects between conditions in fMRI data (Murphy et al. 2007). Note that virtually all of the anterior temporal lobes far exceed this threshold, with many anterior temporal regions exceeding a TSNR of 200.

