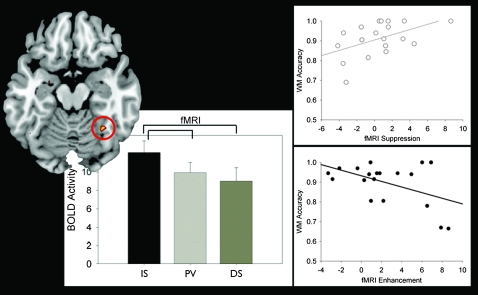
Figure 4.
FFA modulation and correlations with WM accuracy: The BOLD response in the FFA to interruptors (IS), passively viewed stimuli (PV), and distractors (DS) are presented in the bar graphs. The BOLD response was highest in response to the interruptors and lowest to the distractors (enhancement [IS > PV, P < 0.01]). Right panels: The amount that participants allocate attention toward an interruptor or away from a distractor (vs. passively viewed intervening stimuli) correlates with their WM performance (R = −0.54, P < 0.05; R = 0.53, P < 0.05, respectively). These results replicate the EEG findings (Fig. 3).

