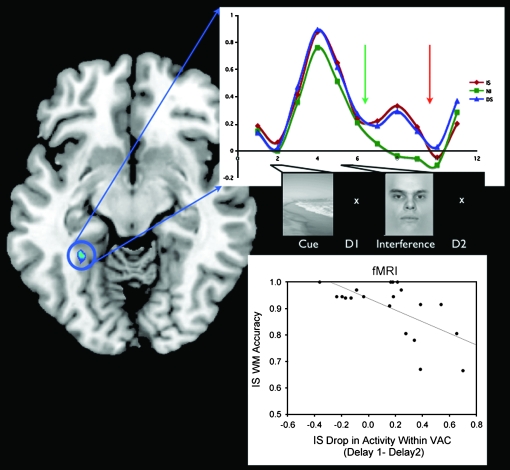
Figure 5.
Time course of BOLD activity within the PPA and correlation with WM accuracy. The time series of the percent signal change in the PPA in IS, DS, and NI are plotted. The amount of decrement in the PPA signal in IS compared with DS is significant during delay2 (orange arrow, P < 0.05). Bottom right: the amount that PPA activity drops in IS between delay1 (green arrow) and delay2 negatively correlates with WM accuracy on the IS task.

