Figure 1.
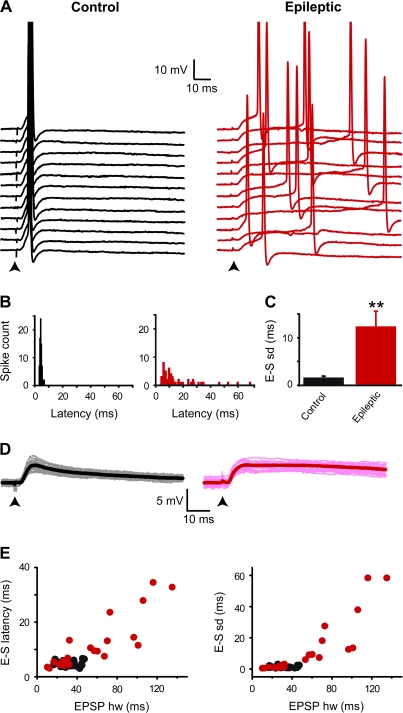
Decreased temporal precision of EPSP–spike coupling in epileptic rats. (A) In a granule cell from a control rat, spikes were generated on the rising phase of the EPSPs (stimulation at arrow) at short latencies and with little variability (black traces on the left, mean latency SD = 0.9 ms, Vm = −51.4 mV). In a granule cell from an epileptic rat, spikes occurred both at short and at long latencies with a large variability (red traces on the right, mean latency SD = 12.6 ms, Vm = −51.3 mV). Traces are aligned at EPSP onset. (B) Spike latency histograms of the cells shown in A (control: black columns, n = 75 spikes; epileptic: red columns, n = 77 spikes). (C) Bar graph of the mean EPSP–spike latency SD in control cells (n = 38) and in cells from epileptic rats (n = 23, **P < 0.01). (D) Superimposed subthreshold EPSPs recorded simultaneously to the suprathreshold EPSPs shown in A in the same cells from control (grey traces, left) and epileptic (pink traces, right) rats at threshold holding potential; black and red traces depict the average subthreshold EPSPs from control (left) and epileptic (right) rats, respectively. (E) Scatter plots of the EPSP–spike (E–S) latency and latency SD plotted against EPSP half width (hw) for n = 38 granule cells from control (black circles) and n = 23 granule cells from epileptic rats (red circles). Note that in this and following figures, spikes are truncated and electrical stimulations (performed in the inner one-third of the molecular layer of the dentate gyrus) are indicated by black arrows below the traces; all recordings were performed in the presence of 10 μM bicuculline, 40 μM D-APV (or 10 μM MK801), and 5 μM CGP 55845, except when otherwise stated.

