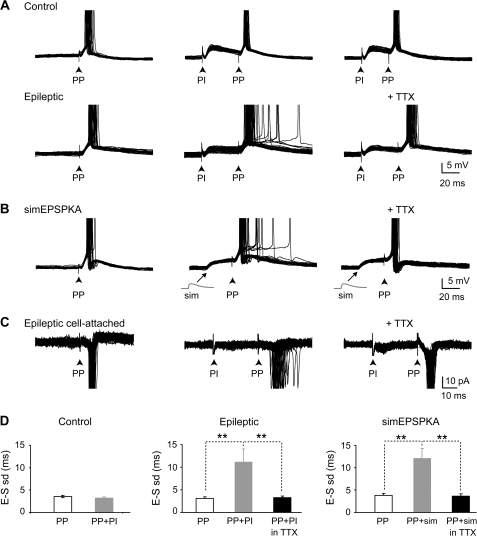
Figure 6.
Aberrant EPSPKA tune PP-EPSPs to fire with a low temporal precision during synaptic integration. (A) Control: superimposed suprathreshold EPSPs evoked by stimulation (black arrow) of the PP in the outer one-third of the molecular layer alone (left) or following PI by stimulation in the inner one-third of the molecular layer (ISI = 40 and 30 ms; middle and right) in a granule cell from control rat. Note that PP-EPSPs evoked time-locked spikes in single-spike mode following PP stimulation alone (SD = 2.8 ms) and that the temporal precision of PP-EPSP-spike coupling was not modified during synaptic integration with PI-EPSP (SD = 1.2 ms, ISI = 40 ms; SD = 1.3 ms, ISI = 30 ms). Epileptic: same protocol in a DGC from an epileptic rat. Note that PP-EPSPs also evoked time-locked spikes in single-spike mode following PP stimulation alone (SD = 2.8 ms) but that the temporal precision of PP-EPSP-spike coupling is greatly decreased during synaptic integration with PI-EPSPKA (SD = 10.2 ms, ISI = 40 ms; middle). This effect was fully reversed by 10 nM TTX superfusion (SD = 2.8 ms, ISI = 40 ms; right). (B) Superimposed supra-threshold EPSPs evoked by PP stimulations alone (left) or following somatic injection of a simulated EPSPKA (sim; middle) in a granule cell from control rat. Note that PP-EPSPs evoked time-locked spikes in single-spike mode following PP stimulation alone (SD = 4.3 ms) but jittered spikes during synaptic integration with simulated EPSPKA (SD = 11.3 ms, ISI = 30 ms). This effect was fully reversed by 10 nM TTX superfusion (SD = 1.6 ms, ISI = 30 ms; right). (C) Same as in A-epileptic in more physiological conditions (i.e., in ACSF without any drug and in cell-attached configuration). Note that PP stimulation also evoked time-locked spikes in single-spike mode in these conditions (SD = 0.8 ms, ISI = 30 ms; right) and jittered spikes following PI stimulation (SD = 4.0 ms; ISI = 30 ms; middle). This effect was fully reversed by 10 nM TTX superfusion (SD = 1.0 ms, ISI = 30 ms; right). (D) Bar graph of the mean EPSP-spike latency standard deviation (E–S SD) for PP stimulation alone (PP, white), PP stimulations following PI stimulations (PP + PI; grey) or PP stimulations following PI stimulations in the presence of TTX 10 nM (PP + PI in TTX, black) for DGCs from control rats (n = 8 cells; P > 0.05; left), epileptic rats (n = 11 cells for PP and PP + PI, and n = 5 for PP + PI in TTX; **P < 0.01; middle) and simEPSPKA (n = 10 cells for PP and PP + simEPSPKA, and n = 8 for PP + simEPSPKA in TTX; **P < 0.01; right).

