
Figure 6. Comparison of Macrophage Cell Response with Matrix Coatings.
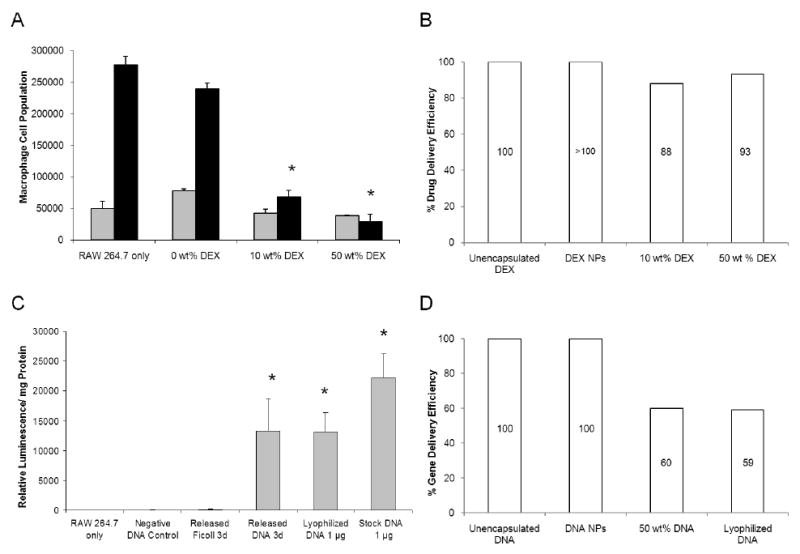
(A) The anti-inflammatory drug was released directly into cell culture for 7 days from DEX matrix coated probes. 15.3 ± 0.1 μg and 154.6 ± 6.3 μg of DEX was released from 10 wt% and 50 wt% matrix coatings respectively, which corresponded to near 90% drug delivery efficiency for both in comparison with unencapsulated DEX of same amount. (B) This value was compared with the % drug delivery efficiency obtained by DEX NP coating. (C) 28.5 ± 0.3 μg of plasmid DNA released from 50 wt% DNA matrix coatings on day 3 was diluted to 1 μg per well and was complexed with Lipofectamine™ before introduction to cell culture. The transfection result of DNA matrix coatings (13,000 ± 5,000 relative luminescence/mg total protein) was equivalent to 60% gene delivery efficiency, in comparison with unencapsulated, stock plasmid DNA of same amount. (D) This value was compared with the % gene delivery efficiency obtained by DNA NP coating. (Grey bars = 3 days, black bars = 7 days, n = 3) *denotes statistical difference between the test groups and the untreated RAW 264.7