
Fig. 2.
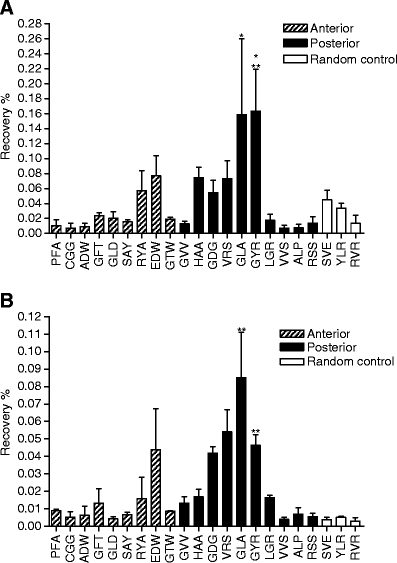
Incubation of phage with hCMEC/D3 cells, recovery expressed as a percentage of the input. Mean±S.D.,n = 3. A. Recovery of phage after glycine wash (cell surface-bound phage). One way ANOVA after log transformation to correct for non-Gaussian distributions with Newman-Keuls correction for multiple comparisons *p < 0.05 GLA vs RVR and GYR vs YLR. **p < 0.01 GYR vs RVR. B. Recovery of phage after subsequent cell lysis (strongly bound/internalized phage). One way ANOVA after log transformation with Newman-Keuls correction for multiple comparisons **p < 0.01 vs all controls. Anterior vs posterior Mann-Whitney test p < 0.01.